
Exhibits


A selection of historical publications from the Women’s Bureau found in UM Libraries Federal Documents Collection
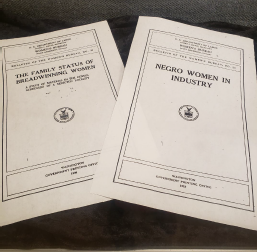
(left to right)
- The Family Status of Breadwinning Women, 1926
- Negro Women in Industry, 1922
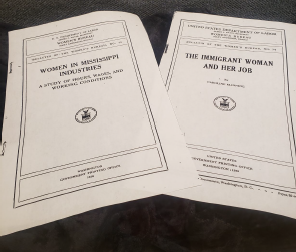
(left to right)
- Women in Mississippi Industries: A Study of Hours, Wages, and Working Conditions, 1926
- The Immigrant Woman and Her Job by Caroline Manning, 1930

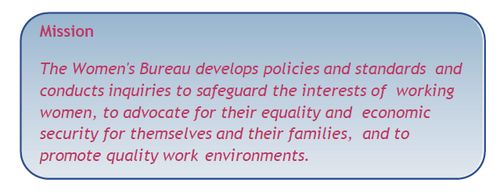
About the Women's Bureau
- Established on June 5, 1920, the Women's Bureau is the only federal agency tasked with focusing exclusively on working women and the issues they care about most.
- For 100 years, the Women's Bureau has served as a trusted source for research, data and statistics, advocacy, and innovation for working women and the issues they care most about.
- WB approach
- Research and policy analysis
- Grant-making
- Education and outreach
Information from: Women’s Bureau, U.S. Department of Labor, https://www.dol.gov/agencies/wb
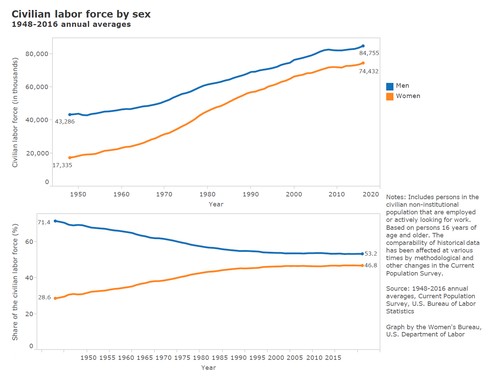
Women in the Labor Force Then and Now
- Women now have fully 50% of all nonfarm payroll jobs in the U. S. (Data as of January 10, 2020) (1)
- The total number of women 16 and older in the labor force has risen almost tenfold from about 8 million in 1920 to more than 78 million today. (2)
- Today, about three-fourths (77%) of prime-working age women (25-54) are in the labor force compared with about 21% when the Women's Bureau first opened its doors in 1920. (3)
- During 2019, the adult women's unemployment rate was the lowest since 1953 and remains near historic lows at 3.2%. (4)
- Mothers are now equal, primary or sole earners in 40% of all U. S. households with children under the age of 18. In comparison, this figure was just 11% in 1960. (5)
- Employment of women on nonfarm payrolls by industry sector, seasonally adjusted (Table B-5). Bureau of Labor Statistics, U.S. Department of Labor (2020). Issued February 7. https://www.bls.gov/news.release/empsit.t21.htm.
- U.S. Census Bureau 1920 Decennial Census and 2018 American Community Survey data. Analysis by the Women’s Bureau (2020).
- U.S. Census Bureau 1920 Decennial Census and 2018 American Community Survey data. Analysis by the Women’s Bureau (2020).
- Employment status of the civilian population by sex and age (Table A-1). Bureau of Labor Statistics, U.S. Department of Labor (2020). Issued February 7. https://www.bls.gov/news.release/empsit.t01.htm
- Percent of households with children under 18 in which mothers are equal, primary, or sole earners. Women’s Bureau, U.S. Department of Labor (2019). https://www.dol.gov/agencies/wb/data/mothers-and-families.
Information from: Women’s Bureau, U.S. Department of Labor, https://www.dol.gov/agencies/wb
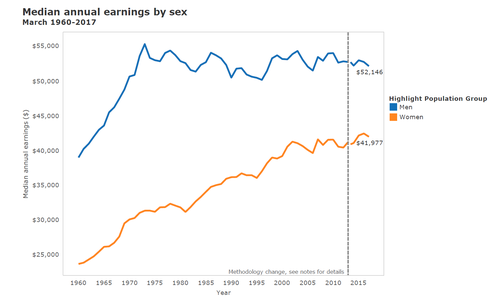
Notes: Earnings are based on median annual earnings of full-time, year-round workers, 15 years old and over beginning in March, 1980, and age 14 years old and over as of March of the following year for previous years. Before 1989 earnings are for civilian workers only.
The comparability of historical data has been affected at various times by methodological and other changes in the Current Population Survey. The 2014 CPS ASEC included redesigned questions for income and health insurance coverage for a subsample of the 98,000 addresses using a probability split panel design. Approximately 68,000 addresses were eligible to receive a set of income questions similar to those used in the 2013 CPS ASEC and the remaining 30,000 addresses were eligible to receive the redesigned income questions, resulting in two estimates for 2013. Estimates based on the portion of the sample that received the redesigned income questions are the most appropriate for comparing estimates from ASEC 2014 with ASEC 2015 and beyond.
Earnings are in 2017 CPI-U-RS adjusted dollars.
Source: 1961-2018 Annual Social and Economic Supplements, Current Population Survey, U.S. Census Bureau.
Graph by the Women's Bureau, U.S. Department of Labor
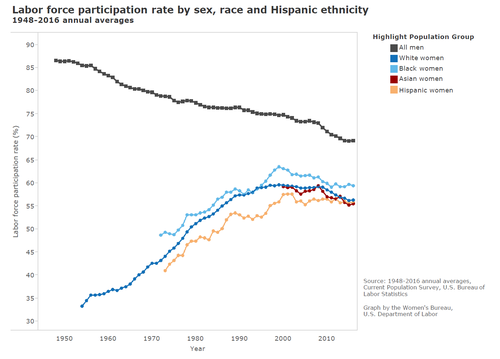
Notes: Represents the percentage of persons in the civilian noninstitutional population 16 years of age and older that are employed or actively looking for work. Estimates for the race groups will not sum to totals because data are not presented for all races. Data for the individual race groups do not include people of two or more races. Hispanics can be of any race. The comparability of historical data has been affected at various times by methodological and other changes in the Current P..
Works Cited:
U.S. Department of Labor, “100 Years: Women’s Bureau, Our Purpose. Your Work.”
Women’s Bureau, U.S. Department of Labor, https://www.dol.gov/agencies/wb
Records of the Women's Bureau, 1892 – 1995, National Archives, Identifier: 522880, https://catalog.archives.gov/id/522880
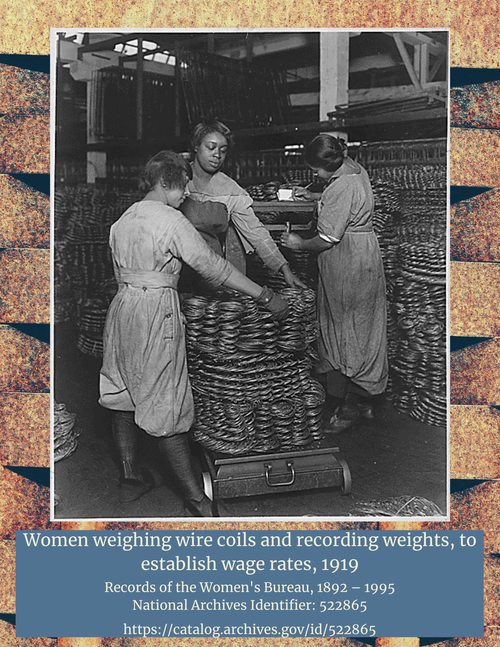
Records of the Women's Bureau, 1892 – 1995, National Archives, Identifier: 522865, https://catalog.archives.gov/id/522865
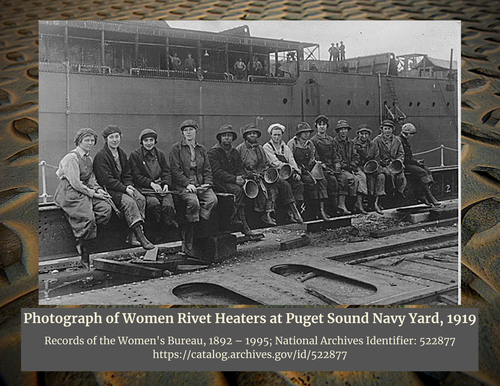
Records of the Women's Bureau, 1892 – 1995, National Archives, Identifier: 522877, https://catalog.archives.gov/id/522877
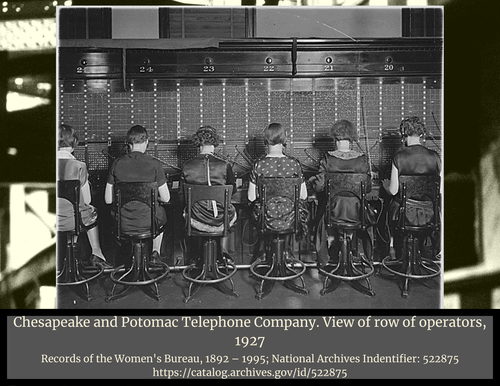
Records of the Women's Bureau, 1892 – 1995, National Archives, Identifier: 522875, https://catalog.archives.gov/id/522875